
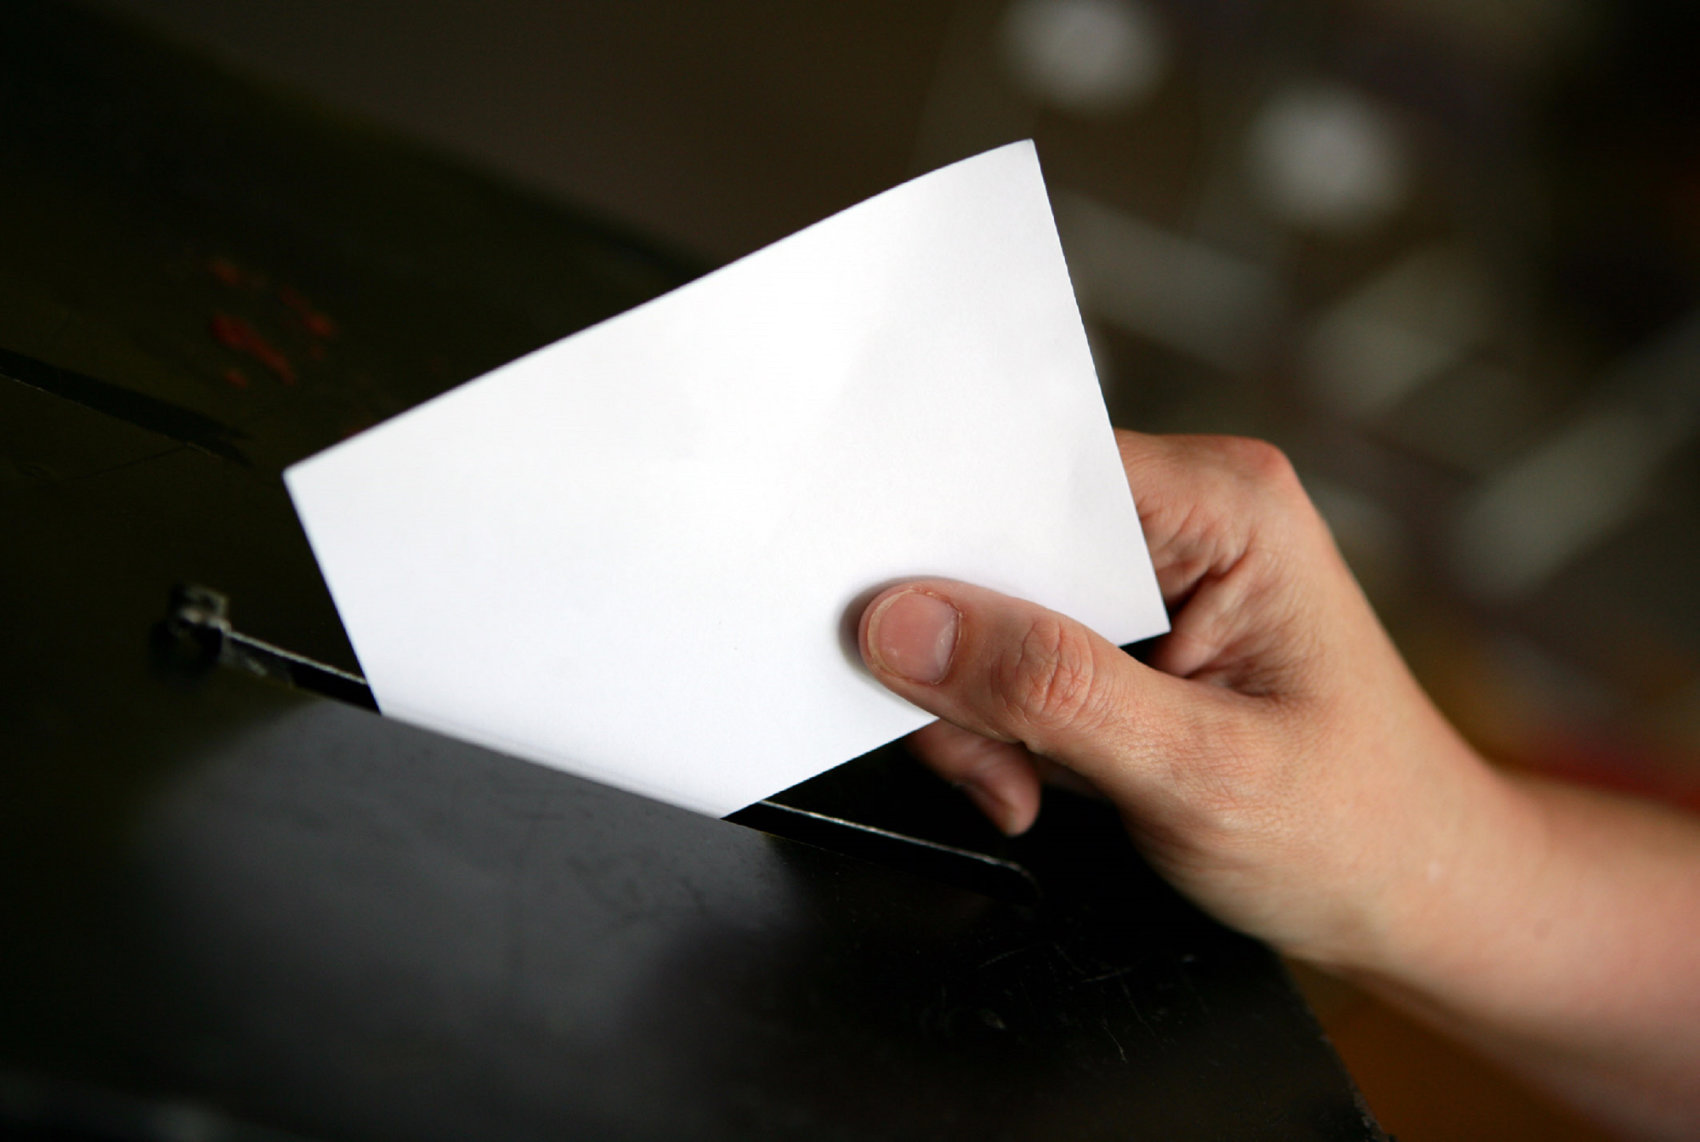
The Count for the Harrogate Town Council Elections took place today (2 May 25)
There were 19 Wards
The results:
- 2 – Conservative
- 1 – Reform UK
- 15 – Lib Dem
- 1 – Independent
| Election Candidate | Party | Votes | % | Outcome |
|---|---|---|---|---|
| Liberal Democrats | 325 | 40% | Elected | |
| Reform UK | 200 | 25% | Not elected | |
| Conservative | 140 | 17% | Not elected | |
| Labour | 82 | 10% | Not elected | |
| Green Party | 66 | 8% | Not elected |
| Election Candidate | Party | Votes | % | Outcome |
|---|---|---|---|---|
| Liberal Democrats | 689 | 52.8% | Elected | |
| Reform UK | 113 | 8.6% | Not elected | |
| Conservative | 391 | 29.9% | Not elected | |
| Labour | 43 | 3.3% | Not elected | |
| Green Party | 68 | 5.21% | Not elected |
| Election Candidate | Party | Votes | % | Outcome |
|---|---|---|---|---|
| Liberal Democrats | 394 | 48.70% | Elected | |
| Reform UK | 222 | 27.4% | Not elected | |
| Conservative | 140 | 17.30% | Not elected | |
| Labour | 58 | 7.17% | Not elected | |
| Green Party | 64 | 7.91% | Not elected |
| Election Candidate | Party | Votes | % | Outcome |
|---|---|---|---|---|
| Reform UK | 344 | 42% | Elected | |
| Liberal Democrats | 268 | 33% | Not elected | |
| Conservative | 127 | 15% | Not elected | |
| Green Party | 82 | 10% | Not elected |
| Election Candidate | Party | Votes | % | Outcome |
|---|---|---|---|---|
| Liberal Democrats | 451 | 45% | Elected | |
| Conservative | 366 | 37% | Not elected | |
| Reform UK | 182 | 18% | Not elected |
| Election Candidate | Party | Votes | % | Outcome |
|---|---|---|---|---|
| Liberal Democrats | 297 | 44% | Elected | |
| Reform UK | 222 | 33% | Not elected | |
| Green Party | 82 | 12% | Not elected | |
| Conservative | 78 | 11% | Not elected |
| Election Candidate | Party | Votes | % | Outcome |
|---|---|---|---|---|
| Liberal Democrats | 333 | 41% | Elected | |
| Green Party | 248 | 30% | Not elected | |
| Conservative | 241 | 29% | Not elected |
| Election Candidate | Party | Votes | % | Outcome |
|---|---|---|---|---|
| Liberal Democrats | 388 | 43% | Elected | |
| Reform UK | 275 | 31% | Not elected | |
| Conservative | 134 | 15% | Not elected | |
| Green Party | 103 | 11% | Not elected |
| Election Candidate | Party | Votes | % | Outcome |
|---|---|---|---|---|
| Liberal Democrats | 417 | 56% | Elected | |
| Reform UK | 186 | 25% | Not elected | |
| Conservative | 84 | 11% | Not elected | |
| Green Party | 62 | 8% | Not elected |
| Election Candidate | Party | Votes | % | Outcome |
|---|---|---|---|---|
| Conservative | 410 | 33% | Elected | |
| Green Party | 351 | 28% | Not elected | |
| Liberal Democrats | 287 | 23% | Not elected | |
| Reform UK | 186 | 15% | Not elected |
| Election Candidate | Party | Votes | % | Outcome |
|---|---|---|---|---|
| Liberal Democrats | 221 | 51% | Elected | |
| Conservative | 148 | 34% | Not elected | |
| Reform UK | 67 | 15% | Not elected |
| Election Candidate | Party | Votes | % | Outcome |
|---|---|---|---|---|
| Liberal Democrats | 358 | 37% | Elected | |
| Conservative | 293 | 31% | Not elected | |
| Reform UK | 156 | 16% | Not elected | |
| Green Party | 90 | 9% | Not elected | |
| Labour | 58 | 6% | Not elected |
| Election Candidate | Party | Votes | % | Outcome |
|---|---|---|---|---|
| Liberal Democrats | 549 | 50% | Elected | |
| Conservative | 339 | 31% | Not elected | |
| Reform UK | 144 | 13% | Not elected | |
| Labour | 69 | 6% | Not elected |
| Election Candidate | Party | Votes | % | Outcome |
|---|---|---|---|---|
| Liberal Democrats | 526 | 42% | Elected | |
| Conservative | 299 | 24% | Not elected | |
| Green Party | 191 | 15% | Not elected | |
| Reform UK | 189 | 15% | Not elected | |
| Labour | 58 | 5% | Not elected |
| Election Candidate | Party | Votes | % | Outcome |
|---|---|---|---|---|
| Liberal Democrats | 435 | 40% | Elected | |
| Conservative | 363 | 33% | Not elected | |
| Reform UK | 162 | 15% | Not elected | |
| Green Party | 90 | 8% | Not elected | |
| Labour | 51 | 5% | Not elected |
| Election Candidate | Party | Votes | % | Outcome |
|---|---|---|---|---|
| Liberal Democrats | 377 | 40% | Elected | |
| Reform UK | 254 | 27% | Not elected | |
| Labour | 196 | 21% | Not elected | |
| Conservative | 109 | 12% | Not elected |
| Election Candidate | Party | Votes | % | Outcome |
|---|---|---|---|---|
| Conservative | 152 | 32% | Elected | |
| Liberal Democrats | 150 | 32% | Not elected | |
| Reform UK | 133 | 28% | Not elected | |
| Green Party | 34 | 7% | Not elected |
| Election Candidate | Party | Votes | % | Outcome |
|---|---|---|---|---|
| Liberal Democrats | 323 | 40% | Elected | |
| Green Party | 174 | 21% | Not elected | |
| Conservative | 170 | 21% | Not elected | |
| Reform UK | 145 | 18% | Not elected |
| Election Candidate | Party | Votes | % | Outcome |
|---|---|---|---|---|
| Liberal Democrats | 297 | 44% | Elected | |
| Reform UK | 222 | 33% | Not elected | |
| Green Party | 82 | 12% | Not elected | |
| Conservative | 78 | 11% | Not elected |
| Election Candidate | Party | Votes | % | Outcome |
|---|---|---|---|---|
| Independent | 397 | 38% | Elected | |
| Reform UK | 237 | 23% | Not elected | |
| Liberal Democrats | 235 | 23% | Not elected | |
| Conservative | 121 | 12% | Not elected | |
| Independent | 47 | 5% | Not elected |

Two wards are missing perhaps because two have been duplicated, i.e. coppice valley and new park
Did not know anything about this election